Prometheus
为了实时监控、查看服务的运行情况,服务挂掉后可以立刻收到预警,可以引入服务监控。
Prometheus 简介
通常服务监控的流程如下:
- 先搭个监控服务端
- 各被监控客户端往服务端 push 数据(或服务端定时主动去客户端 pull)
- 服务端把 pull 的数据存到时序数据库中
- 再搭建一个图形面板 Grafana 展示收集的监控数据
Prometheus 是一款开源的时序数据库和监控系统,具有以下特点:
- 多维度数据模型:通过指标名称和键值对标签标识数据。
- 强大的查询语言 PromQL:支持实时聚合和计算。
- 自治架构:不依赖分布式存储,单个节点即可运行。
- 拉取模型:主动从目标服务拉取指标(也支持推送网关)。
- 可视化:原生支持 Grafana 集成。
架构
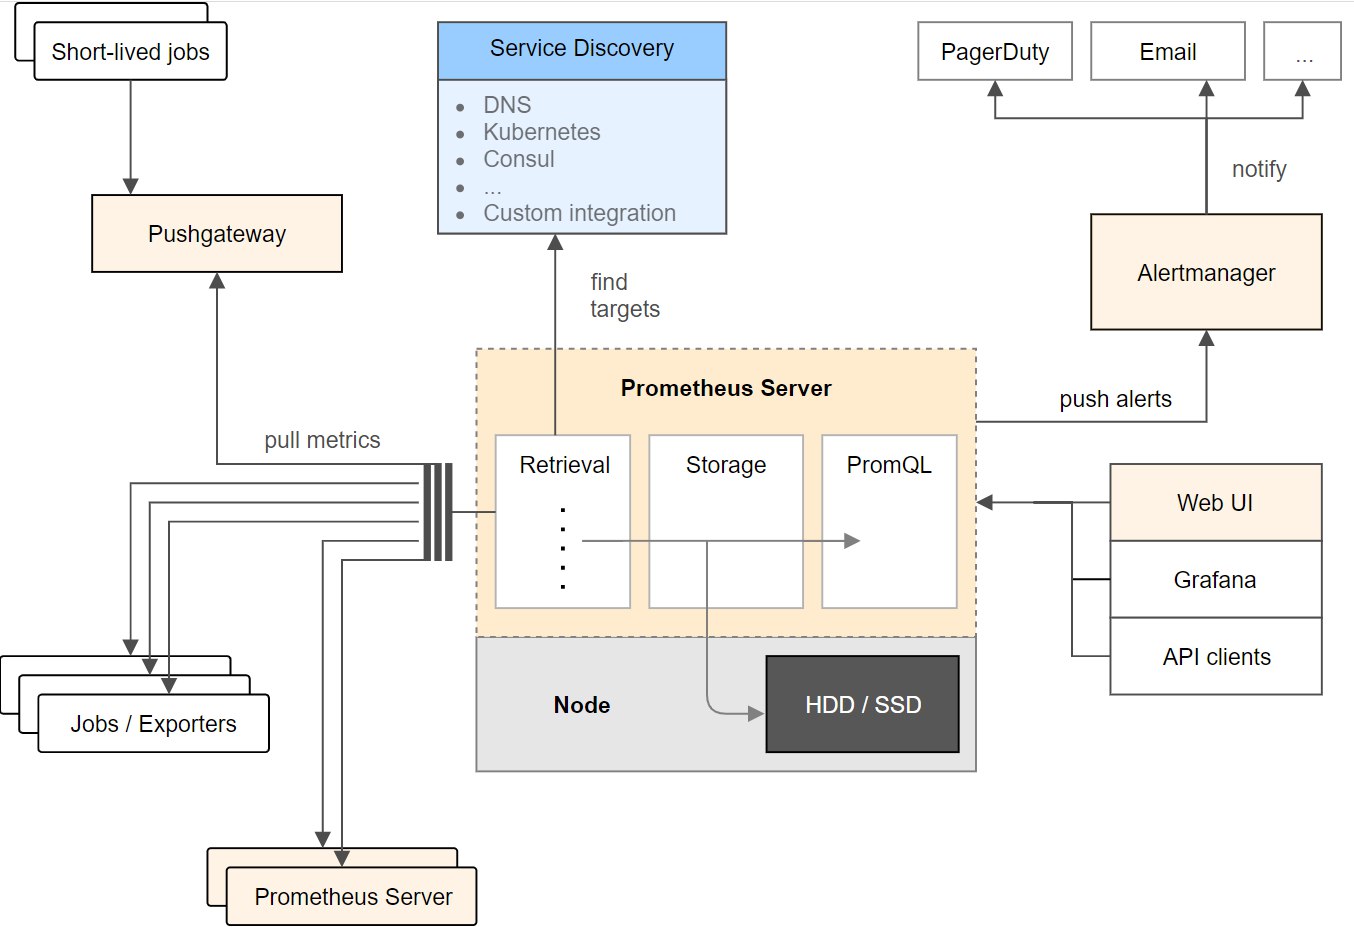
整个 Prometheus 从左到右可以大概分为以下四个部分:
- NodeExporter 业务数据源
负责收集目标对象(如 Host 或 Container )的性能数据,并通过 HTTP 接口供 Prometheus Server 获取。每一个客户端都会提供一个 /metrics 的 get 接口
- Prometheus 服务器
负责从客户端(Exporters)拉取和存储监控数据,并给用户通过 PromQL 查询
- AlertManager 报警管理器
负责根据告警规则和预定义的告警方式发出例如Email、Webhook之类的告警。
- 可视化监控界面
Prometheus 收集到数据之后,由 WebUI 界面进行可视化图标展示。目前我们可以通过自定义的 API 客户端进行调用数据展示,也可以直接使用 Grafana 解决方案来展示。
收集数据、处理数据、可视化展示,再进行数据分析进行报警处理
核心概念
| 概念 | 说明 |
|---|---|
| Metric(指标) | 监控目标的数据指标(如 http_requests_total)。 |
| Label(标签) | 指标的维度标识(如 path="/api")。 |
| Job | 一组监控目标的集合(如 job: im-server)。 |
快速开始
客户端
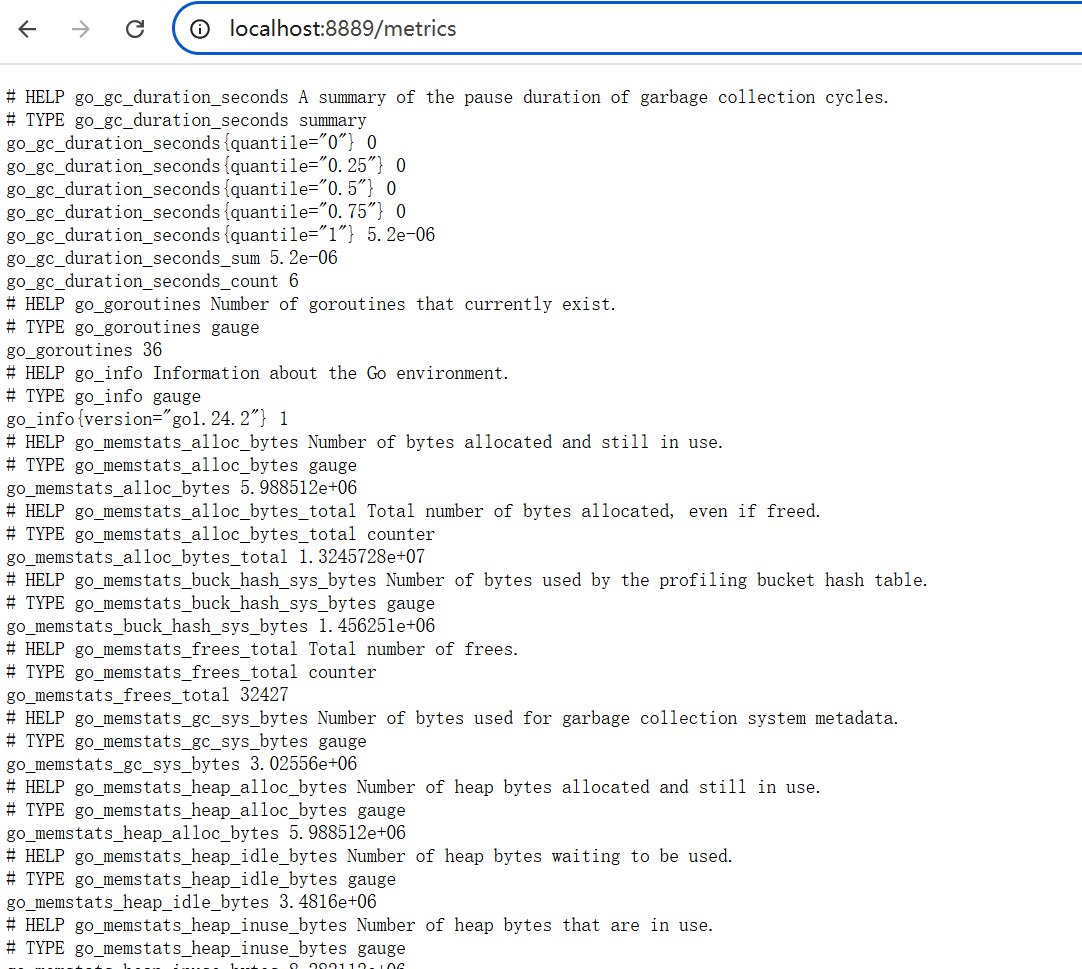
设置 Node Exporter 节点所在机器 在 Go 项目中引入 Prometheus,只需要编写一个带
/metrics端口的服务,如:1package main 2 3import ( 4 "net/http" 5 "github.com/prometheus/client_golang/prometheus/promhttp" 6) 7 8func main() { 9 // 业务路由 10 http.HandleFunc("/", func(w http.ResponseWriter, r *http.Request) { 11 w.Write([]byte("Hello, Prometheus!")) 12 }) 13 14 // Prometheus 指标路由 15 http.Handle("/metrics", promhttp.Handler()) 16 17 // 启动服务 18 http.ListenAndServe(":8889", nil) 19}启动后访问 http://localhost:8889/metrics,可以看到默认的 Go 运行时指标(如内存、GC 等),类似:
添加自定义业务指标
 1package main
 2
 3import (
 4	"net/http"
 5	"github.com/prometheus/client_golang/prometheus"
 6	"github.com/prometheus/client_golang/prometheus/promhttp"
 7)
 8
 9// 定义自定义指标
10var (
11	requestCount = prometheus.NewCounter(
12		prometheus.CounterOpts{
13			Name: "http_requests_total",
14			Help: "Total number of HTTP requests",
15		},
16	)
17)
18
19func init() {
20	// 注册自定义指标
21	prometheus.MustRegister(requestCount)
22}
23
24func main() {
25	http.HandleFunc("/", func(w http.ResponseWriter, r *http.Request) {
26		requestCount.Inc() // 每次请求增加计数器
27		w.Write([]byte("Hello, Prometheus!"))
28	})
29
30	http.Handle("/metrics", promhttp.Handler())
31	http.ListenAndServe(":8080", nil)
32}
测试:
- 重启服务,多次访问
http://localhost:8080/。 - 查看
http://localhost:8080/metrics,会发现http_requests_total指标值增长。
- 重启服务,多次访问
示例:监控请求延迟(Histogram)
 1var (
 2	requestDuration = prometheus.NewHistogram(
 3		prometheus.HistogramOpts{
 4			Name:    "http_request_duration_seconds",
 5			Help:    "Duration of HTTP requests",
 6			Buckets: prometheus.LinearBuckets(0.1, 0.1, 10), // 桶配置
 7		},
 8	)
 9)
10
11func init() {
12	prometheus.MustRegister(requestDuration)
13}
14
15// 在请求处理中记录时间
16func handler(w http.ResponseWriter, r *http.Request) {
17	start := time.Now()
18	defer func() {
19		requestDuration.Observe(time.Since(start).Seconds())
20	}()
21	// ... 业务逻辑
22}
服务端
安装运行 Prometheus 服务端 在 官网 找到最新版本的软件包,下载后解压可以得到如下文件:

编辑配置文件
 1global:
 2  scrape_interval: 15s # 默认情况下,每 15s 采集一次目标数据
 3
 4scrape_configs:
 5  - job_name: "prometheus"    # 监控自己
 6    # Override the global default and scrape targets from this job every 5 seconds.
 7    scrape_interval: 5s
 8    static_configs:
 9      - targets: ["localhost:9090"]
10  - job_name: "test"
11    static_configs:
12      - targets: ["localhost:8889"] # 设置为客户端配置的端口
执行
./prometheus --config.file=prometheus.yml,可以启动服务端
 1time=2025-07-03T16:36:19.936+08:00 level=INFO source=main.go:1544 msg="updated GOGC" old=100 new=75
 2time=2025-07-03T16:36:19.939+08:00 level=INFO source=main.go:676 msg="Leaving GOMAXPROCS=16: CPU quota undefined" component=automaxprocs
 3time=2025-07-03T16:36:19.940+08:00 level=INFO source=memlimit.go:198 msg="GOMEMLIMIT is updated" component=automemlimit package=github.com/KimMachineGun/automemlimit/memlimit GOMEMLIMIT=15164330803 previous=9223372036854775807
 4time=2025-07-03T16:36:19.941+08:00 level=INFO source=main.go:718 msg="No time or size retention was set so using the default time retention" duration=15d
 5time=2025-07-03T16:36:19.941+08:00 level=INFO source=main.go:769 msg="Starting Prometheus Server" mode=server version="(version=3.5.0-rc.0, branch=HEAD, revision=31f0c7007e7187b706da03e05aeeb303101164f8)"
 6time=2025-07-03T16:36:19.941+08:00 level=INFO source=main.go:774 msg="operational information" build_context="(go=go1.24.4, platform=windows/amd64, user=root@cfc05279aa30, date=20250630-13:26:33, tags=builtinassets)" host_details=(windows) fd_limits=N/A vm_limits=N/A
 7time=2025-07-03T16:36:19.951+08:00 level=INFO source=web.go:656 msg="Start listening for connections" component=web address=0.0.0.0:9090
 8time=2025-07-03T16:36:19.952+08:00 level=INFO source=main.go:1288 msg="Starting TSDB ..."
 9time=2025-07-03T16:36:19.952+08:00 level=INFO source=tls_config.go:347 msg="Listening on" component=web address=[::]:9090
10time=2025-07-03T16:36:19.952+08:00 level=INFO source=tls_config.go:350 msg="TLS is disabled." component=web http2=false address=[::]:9090
11time=2025-07-03T16:36:19.955+08:00 level=INFO source=head.go:657 msg="Replaying on-disk memory mappable chunks if any" component=tsdb
12time=2025-07-03T16:36:19.955+08:00 level=INFO source=head.go:744 msg="On-disk memory mappable chunks replay completed" component=tsdb duration=0s
13time=2025-07-03T16:36:19.955+08:00 level=INFO source=head.go:752 msg="Replaying WAL, this may take a while" component=tsdb
14time=2025-07-03T16:36:19.962+08:00 level=INFO source=head.go:825 msg="WAL segment loaded" component=tsdb segment=0 maxSegment=3 duration=6.689ms
15time=2025-07-03T16:36:19.963+08:00 level=INFO source=head.go:825 msg="WAL segment loaded" component=tsdb segment=1 maxSegment=3 duration=515.3µs
16time=2025-07-03T16:36:19.965+08:00 level=INFO source=head.go:825 msg="WAL segment loaded" component=tsdb segment=2 maxSegment=3 duration=1.0233ms
17time=2025-07-03T16:36:19.965+08:00 level=INFO source=head.go:825 msg="WAL segment loaded" component=tsdb segment=3 maxSegment=3 duration=511.2µs
18time=2025-07-03T16:36:19.965+08:00 level=INFO source=head.go:862 msg="WAL replay completed" component=tsdb checkpoint_replay_duration=0s wal_replay_duration=9.2486ms wbl_replay_duration=0s chunk_snapshot_load_duration=0s mmap_chunk_replay_duration=0s total_replay_duration=9.771ms
19time=2025-07-03T16:36:19.967+08:00 level=INFO source=main.go:1309 msg="filesystem information" fs_type=unknown
20time=2025-07-03T16:36:19.967+08:00 level=INFO source=main.go:1312 msg="TSDB started"
21time=2025-07-03T16:36:19.967+08:00 level=INFO source=main.go:1497 msg="Loading configuration file" filename=prometheus.yml
22time=2025-07-03T16:36:19.975+08:00 level=INFO source=main.go:1537 msg="Completed loading of configuration file" db_storage=0s remote_storage=0s web_handler=0s query_engine=0s scrape=7.6932ms scrape_sd=0s notify=0s notify_sd=0s rules=0s tracing=0s filename=prometheus.yml totalDuration=7.6932ms
23time=2025-07-03T16:36:19.975+08:00 level=INFO source=main.go:1273 msg="Server is ready to receive web requests."
24time=2025-07-03T16:36:19.975+08:00 level=INFO source=manager.go:176 msg="Starting rule manager..." component="rule manager"
查询监控数据
配置完 Prometheus 读取的数据源之后,Prometheus 便可以从 Node Exporter 获取到数据了。Prometheus UI 是 Prometheus 内置的一个可视化管理界面,我们通过
http://localhost:9090就可以访问到该页面。在控制台输入查询语句,即可获取对应的数据。默认每隔15秒会从客户端拉取一次数据。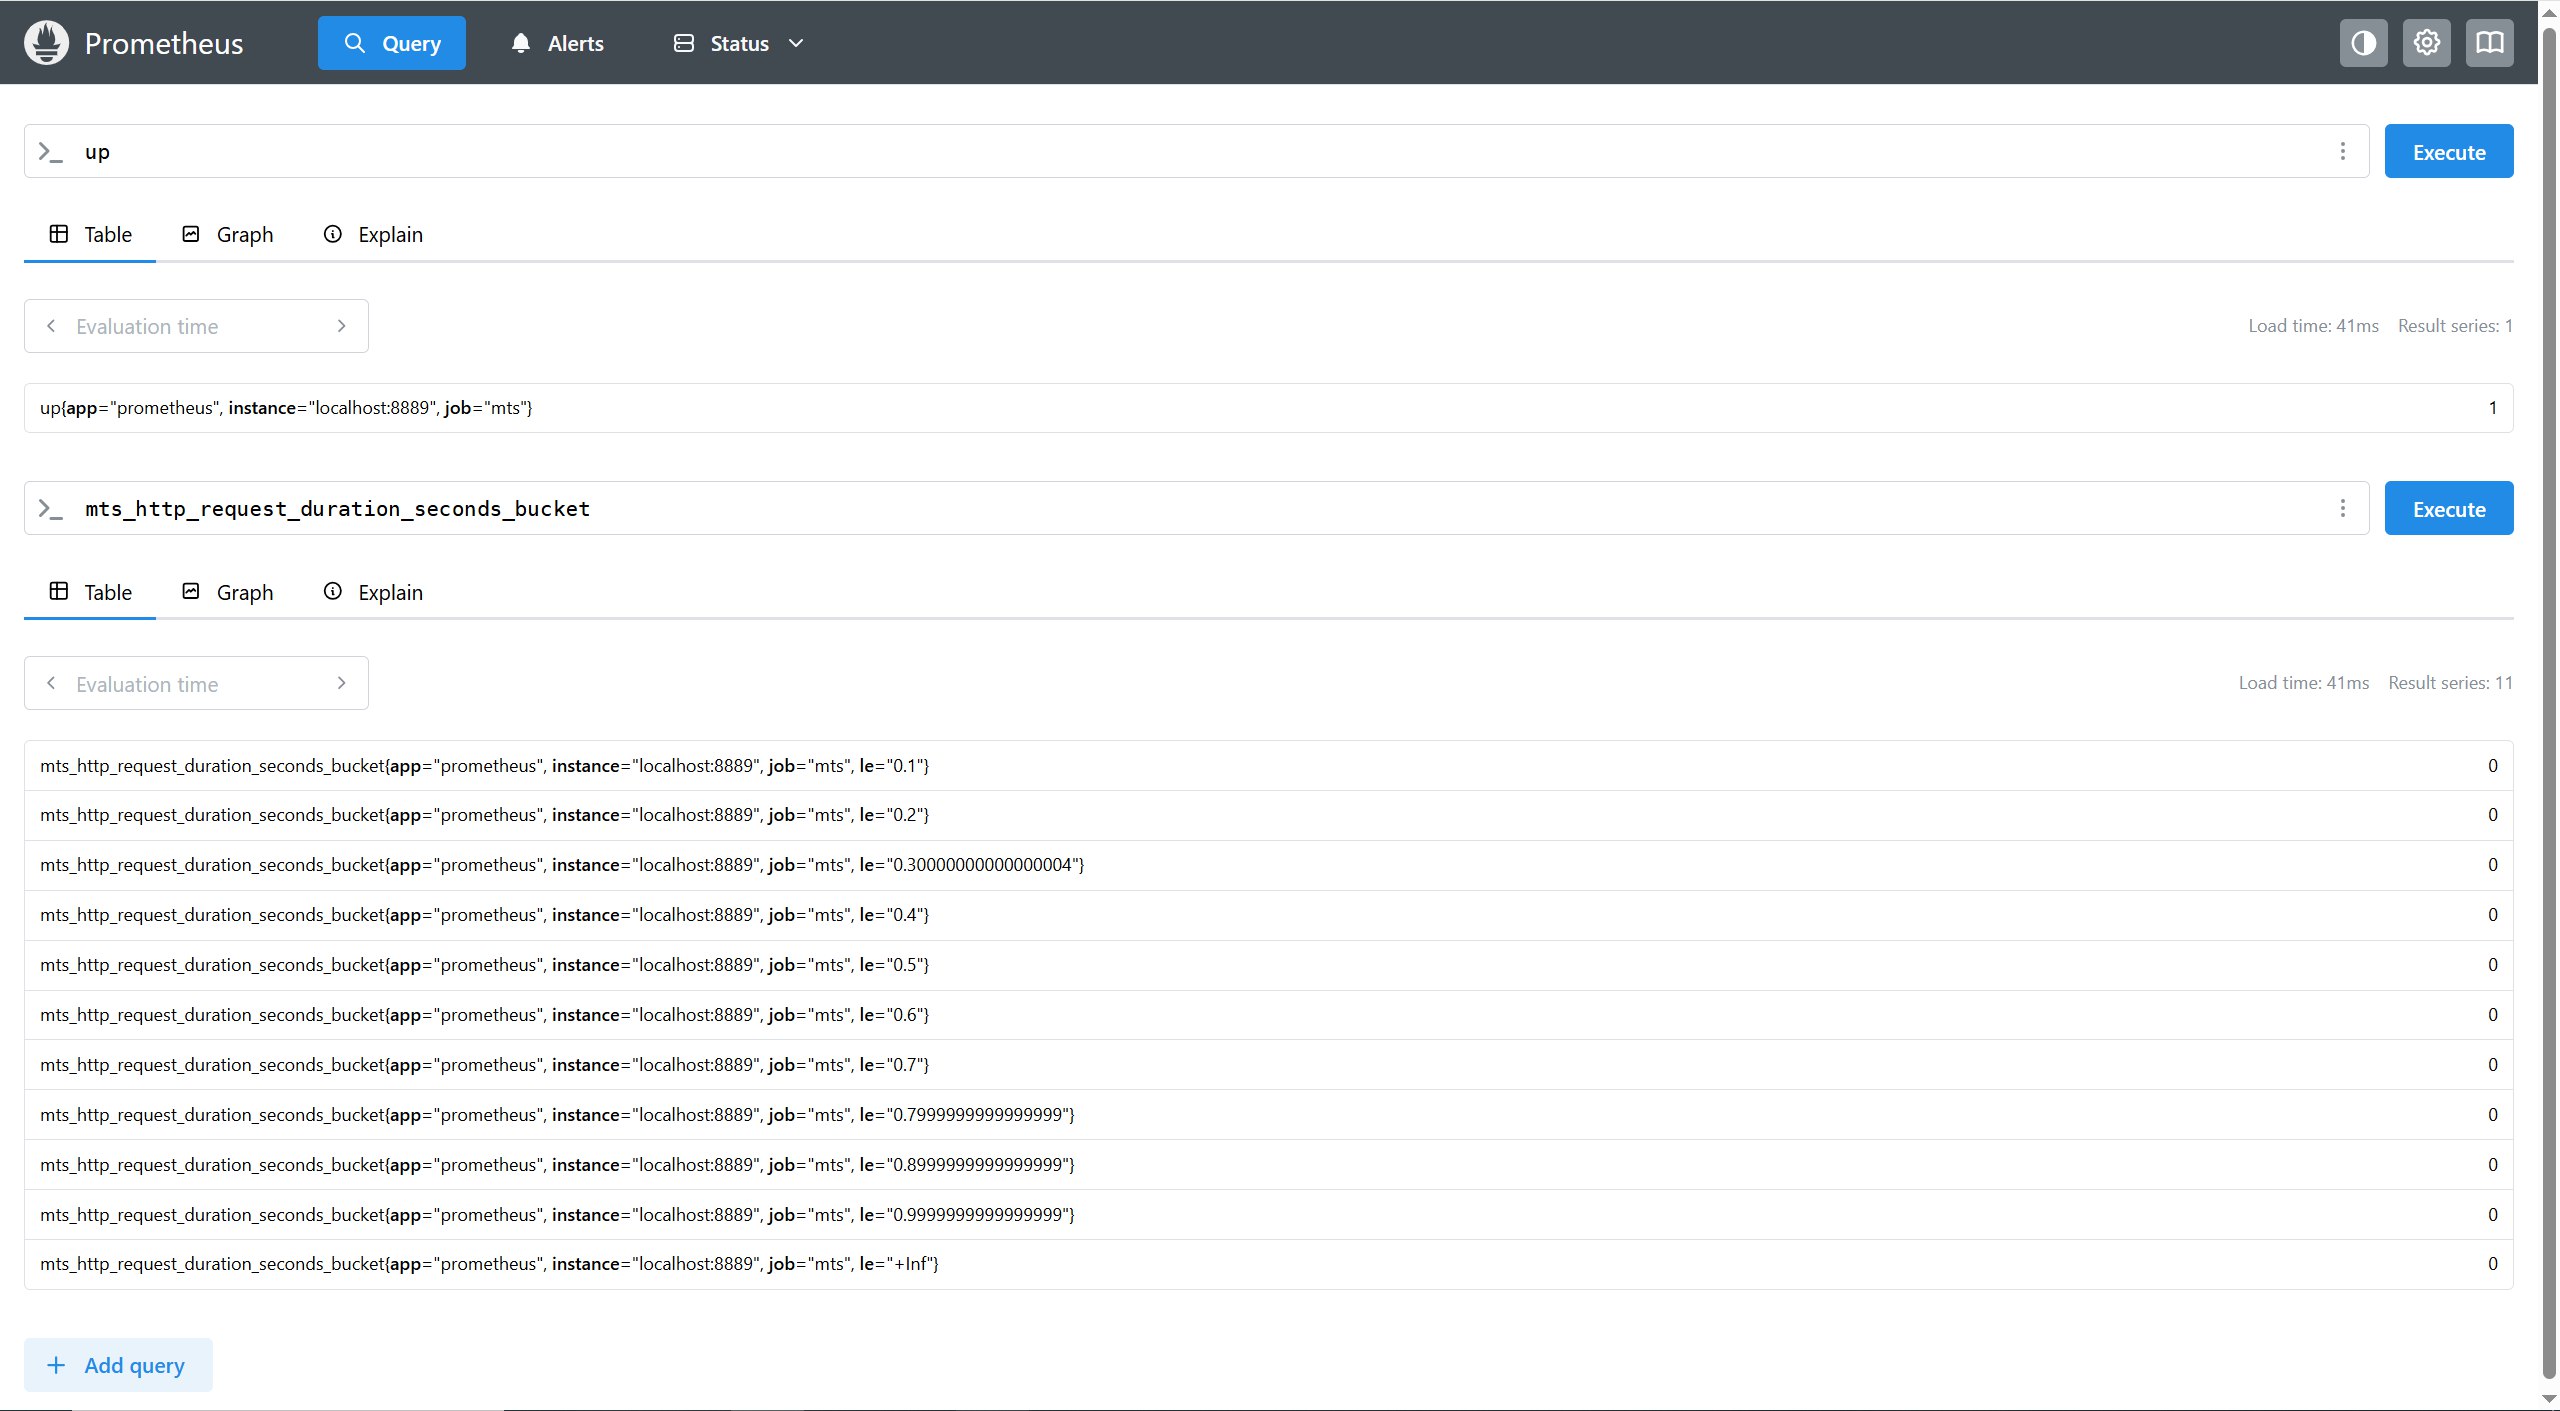
Grafana 可视化
启动 Grafana:
1cd C:\grafana\bin
2.\grafana-server.exe
访问
http://localhost:3000(默认账号admin/admin)。添加 Prometheus 数据源(URL:
http://localhost:9090)。导入或自定义仪表盘。
扩展
常用指标类型
| 类型 | 用途 | 示例 |
|---|---|---|
Counter | 只增不减的计数器 | http_requests_total |
Gauge | 可增减的数值(如内存使用量) | memory_usage_bytes |
Histogram | 统计分布(如响应时间分布) | http_request_duration_seconds |
Summary | 类似 Histogram,但计算分位数在客户端 | request_latency_seconds |
Counter 常用于:
记录不同的API的请求数量
记录kafka消费的不同类型消息数量
记录业务错误码触发数量
Gauge 常用于:
记录服务的内存的占用
记录服务CPU的占用
记录队列的长度
Histogram 常用于:
- 比如我们的API服务的请求耗时,在所有的bucket分布情况。
- 比如我们消费者处理某个事件的耗时,在所有的bucket分布情况。
Summaries 常用于:
- API服务的请求耗时,大部分是落在哪个区间
生产建议
指标命名规范:使用
_total、_seconds等后缀(官方约定)。标签(Labels):通过标签区分不同维度的数据(如按路由或状态码):
1requestCount = prometheus.NewCounterVec( 2 prometheus.CounterOpts{ 3 Name: "http_requests_total", 4 Help: "Total requests by path and status", 5 }, 6 []string{"path", "status"}, 7) 8// 使用时: 9requestCount.WithLabelValues("/api", "200").Inc()避免指标爆炸:不要滥用标签(如用户ID这种高基数标签)。
IM 实例
核心监控场景
消息处理性能监控
- 指标示例:
im_message_processing_duration_seconds(消息处理耗时)im_messages_sent_total(消息发送总量)im_messages_delivered_total(消息投递成功量)
- 用途:
- 实时检测消息延迟(如 P99 延迟超过 500ms 告警)。
- 统计消息吞吐量(QPS),评估系统负载。
- 指标示例:
在线用户与会话状态
- 指标示例:
im_active_users_gauge(当前在线用户数)im_sessions_active(活跃会话数)im_connections_count(WebSocket/TCP 连接数)
- 用途:
- 发现异常连接断开(如连接数骤降可能预示网络问题)。
- 评估服务器容量(如单机连接数接近上限时扩容)。
- 指标示例:
消息队列积压监控
- 指标示例:
im_mq_pending_messages(消息队列积压数)im_mq_consumer_lag_seconds(消费延迟)
- 用途:
- 发现消费能力不足(如 Kafka/RabbitMQ 积压告警)。
- 指标示例:
API 接口健康度
- 指标示例:
im_api_requests_total{path="/send", status="200"}(按接口和状态码统计)im_api_failure_rate(接口错误率)
- 用途:
- 快速定位故障接口(如登录接口 500 错误率飙升)。
- 指标示例:
示例
在 IM 服务中暴露指标
 1import (
 2	"github.com/prometheus/client_golang/prometheus"
 3	"github.com/prometheus/client_golang/prometheus/promhttp"
 4)
 5
 6// 定义指标
 7var (
 8	messageSentCount = prometheus.NewCounterVec(
 9		prometheus.CounterOpts{
10			Name: "im_messages_sent_total",
11			Help: "Total number of messages sent",
12		},
13		[]string{"user_type"}, // 按用户类型区分(如 "bot", "human")
14	)
15
16	messageProcessingTime = prometheus.NewHistogram(
17		prometheus.HistogramOpts{
18			Name:    "im_message_processing_duration_seconds",
19			Help:    "Time taken to process a message",
20			Buckets: []float64{0.01, 0.05, 0.1, 0.5, 1}, // 自定义桶
21		},
22	)
23)
24
25func init() {
26	prometheus.MustRegister(messageSentCount, messageProcessingTime)
27}
28
29// 在消息处理逻辑中记录指标
30func handleMessage(msg string) {
31	start := time.Now()
32	defer func() {
33		messageProcessingTime.Observe(time.Since(start).Seconds())
34	}()
35
36	// 处理消息逻辑...
37	messageSentCount.WithLabelValues("human").Inc()
38}
39
40// 暴露 /metrics 端点
41http.Handle("/metrics", promhttp.Handler())
Prometheus 配置
1# prometheus.yml
2scrape_configs:
3  - job_name: "im-server"
4    static_configs:
5      - targets: ["im-server:8080"]  # IM 服务的地址
告警规则示例
 1# alert.rules.yml
 2groups:
 3- name: im-alerts
 4  rules:
 5  - alert: HighMessageLatency
 6    expr: histogram_quantile(0.99, rate(im_message_processing_duration_seconds_bucket[5m])) > 1
 7    for: 5m
 8    labels:
 9      severity: critical
10    annotations:
11      summary: "High message processing latency (instance {{ $labels.instance }})"
12      description: "P99 message latency is {{ $value }}s"
高级应用场景
消息广播性能
群聊消息广播时,如何监控扩散延迟
方案:
 1// 记录消息从发送到所有接收者的延迟
 2broadcastDuration := prometheus.NewSummaryVec(
 3    prometheus.SummaryOpts{
 4  	  Name: "im_broadcast_duration_seconds",
 5  	  Help: "Time for a message to reach all recipients",
 6    },
 7    []string{"group_size"},
 8)
 9
10// 在广播完成后记录
11broadcastDuration.WithLabelValues("50").Observe(elapsed.Seconds())
在线状态同步
问题:如何监控用户在线状态同步延迟?
方案:
1# 计算状态同步的平均延迟
2rate(im_status_sync_duration_seconds_sum[5m]) / rate(im_status_sync_duration_seconds_count[5m])
消息丢失检测
问题:如何确保消息不丢失
方案:
1# 检查发送和投递计数是否匹配
2(im_messages_sent_total - im_messages_delivered_total) > 0
生产环境建议
标签设计:避免高基数标签(如
user_id),改用user_type等低基数维度。采样率:高频消息场景可抽样记录指标(如每 100 条消息记录 1 次)。
多维度聚合:
1# 按消息类型统计延迟
2histogram_quantile(0.9, sum by (le, msg_type) (rate(im_message_processing_duration_seconds_bucket[5m])))